One of the classic dilemmas for dividend growth investors is whether to focus on higher yielding, but slower growing companies or low yield, high growth companies. The answer is not clear-cut, and depends largely on the investor’s time frame and goals for his or her portfolio.
First, let’s define what we mean by high yield or high growth. Over the last twenty years, the S&P 500 has averaged a yield of 1.5%-2.5% with dividend growth of 6-10%. Keep in mind this includes companies which don’t pay a dividend. Using these numbers as a guideline for the average company but adjusting the yield upward to account for non-dividend payers, let’s use the following definitions:
- Low yield: <1.5%
- Average yield: 1.5-3.5%
- High yield: >3.5%
- Low growth: <5%
- Average growth: 5-10%
- High growth: >10%
You can obviously adjust the cut-offs, and not every company will fit neatly into a specific category, but this is a good starting point for our discussion.
Dividend growth investors largely fall into two categories: income focused, and total return focused. Income investors view dividend growth stocks as a recurring income stream which grows above the rate of inflation. Total return investors, on the other hand, see dividend growth stocks as high quality, well managed companies which are capable of providing superior total returns over a long time frame. The former tend to prefer higher yielding stocks while the latter naturally gravitate towards high growth names.
Let’s look at the math behind 3 popular metrics for dividend growth investors: yield on cost, cumulative dividend income, and total return. In order to do so, we will have to make the major assumptions that dividend yield and growth rate are fixed for the entire time frame studied. This implies absolutely no change in how the market values the companies, no changes in the payout ratio, and that the companies are able to grow at the same rate in perpetuity. We are not factoring in dividend reinvestment, simply a buy and hold strategy. For the purposes of this study, we will compare 3 hypothetical companies: Company A is low yield (1%) high growth (12%); Company B is average yield (3%) and growth (7%); Company C is high yield (5%) low growth (3%).
Yield on Cost
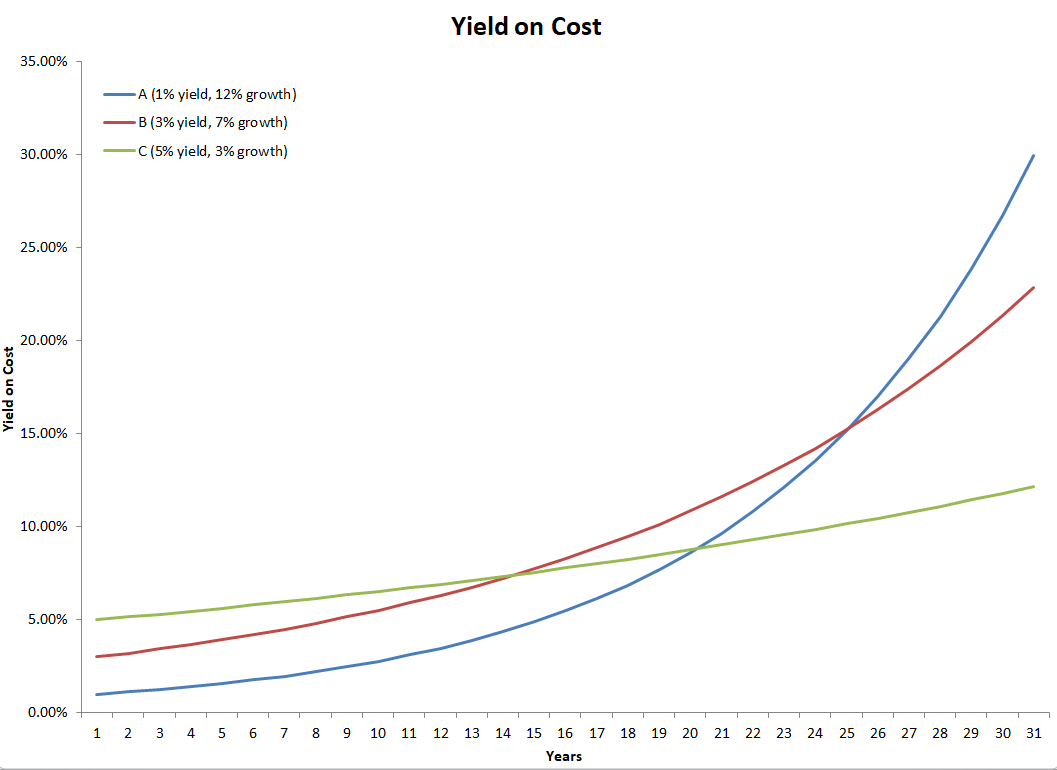
Yield on cost measures the current dividend rate relative to the initial amount paid per share. As can be seen, Company C (high yield, low growth) starts out initially at a higher yield. However, due to its low growth, an average company (Company B, average yield, average growth) will catch up in yield on cost after 14 years and provide greater income subsequently. Similarly, Company A (low yield, high growth) will eventually overtake the high yield, low growth company in yield on cost, although this occurs later, in year 20, due to the lower initial yield. The high growth company A will also eventually surpass the average company B in year 25.
Cumulative Dividends Received
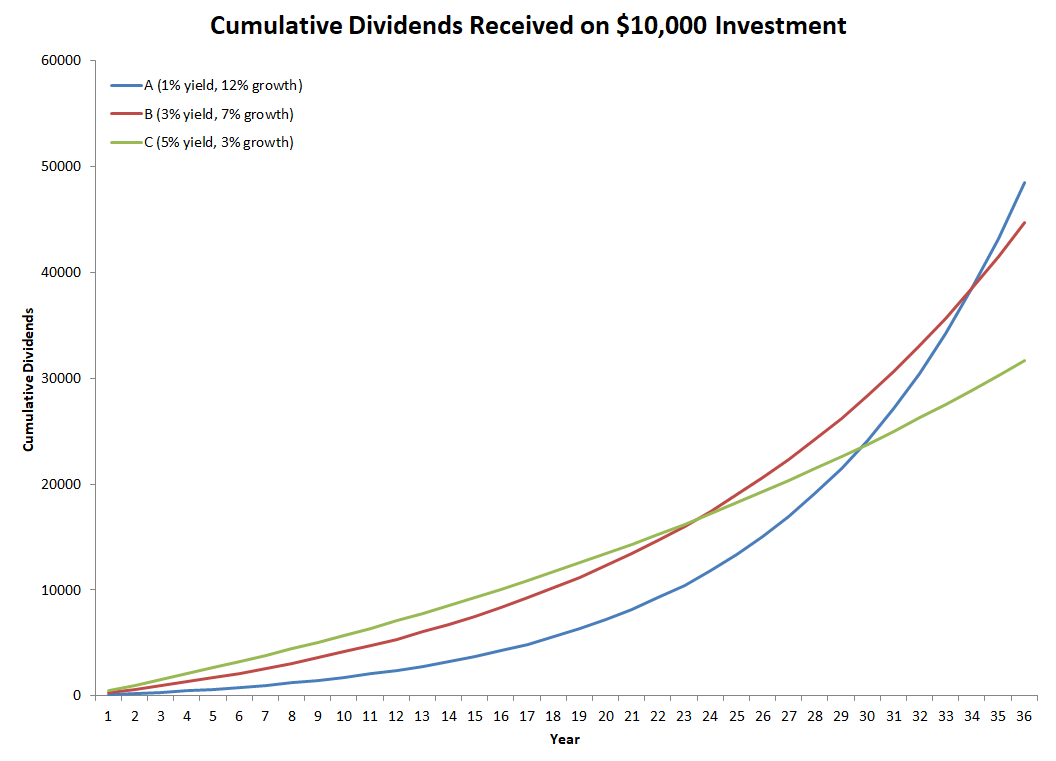
As expected, high yield, low growth Company C produces the most total dividends over the initial period of investment. As you may recall from the previous section, the average Company B starts producing more yearly income after 14 years, but it is not until 24 years have passed that total dividends received exceeds Company C. Similarly, the breakeven for the high growth Company A occurs in year 30. The high growth Company A exceeds the average Company B in year 34.
Total Return
Total return projections require the most assumptions: that companies continue growing at the same rates in perpetuity, that their payout ratios are maintained, and that the market continues to value shares at a similar multiple resulting in an unchanging dividend yield.
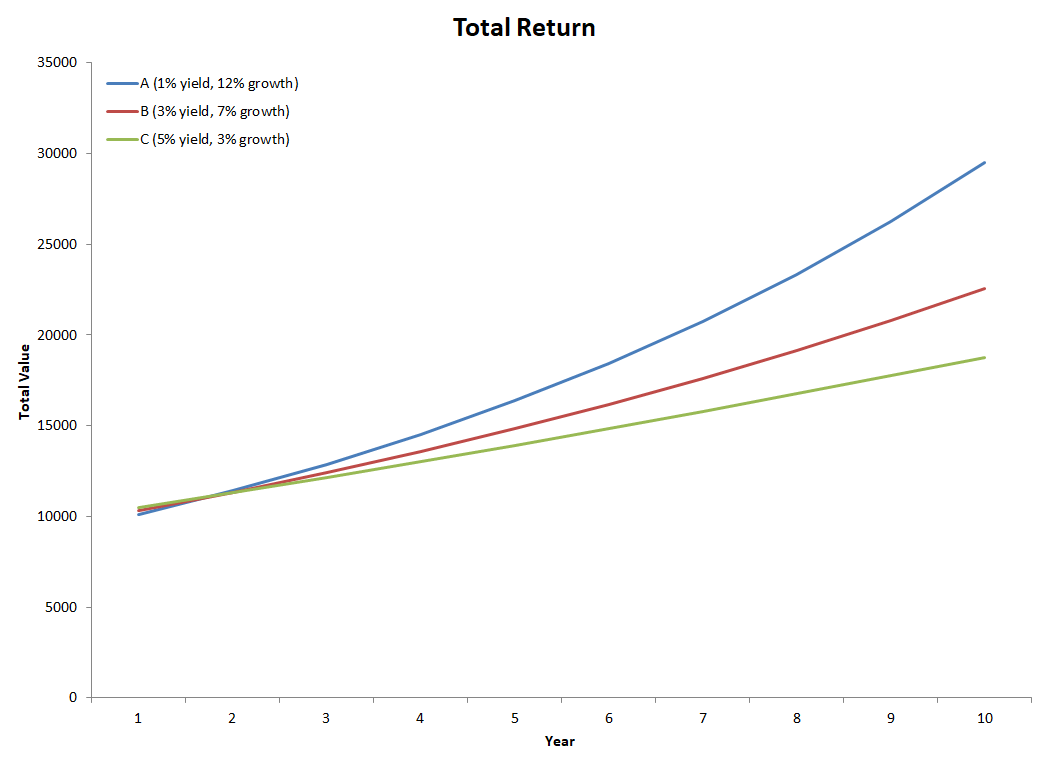
As can be seen, using these assumptions, higher growth rapidly outpaces higher yield, within a couple of years. Within a decade, the investment in high growth Company A would be worth 57% more than the low growth Company C.

Looking into the components of total return, for the high yield low growth case, we see that dividends make up about 64% of total returns over the long term, compared to only 8.5% for the low growth high yield case. The rest is unrealized capital gains based on market valuation of the company.
Conclusions so Far
In this article, we’ve explored the theoretical possibilities for dividend growth stocks. We’ve seen that high yield, low growth stocks can provide superior income streams for up to two decades compared to lower yielding higher growth stocks. As such, high yield stocks are more suitable for investors with shorter time horizons and greater dependence on dividend income, such as those in or nearing retirement. On the other hand, high growth dividend stocks can quickly outperform on a total return basis, often within a few years of initial investment. However, this comes at the cost of increased risk, as the vast majority of returns will come in the form of capital gains, which can quickly be reversed in the event of a selloff.
Theory is nice, but reality is far, far messier. What happens to dividend growth through an economic cycle? What happens when a stellar growth company saturates its market? What about the law of large numbers, where it becomes incrementally more difficult to produce similar rates of growth? What happens to a company’s valuation when its growth profile changes? How do changes in the payout ratio mask the true performance of a company? Stay tuned for an article next week bringing in a dose of messy reality!